Quicklinks
Home prices tend to increase when there are more buyers in the market or fewer homes being listed. These charts show the number of houses and condos being listed each month and how that’s changed over time. Then we provide data on monthly housing inventory, that is, the number of homes on the market at any given point in time. Finally, we provide a detailed comparison of the number of home sales that are closing each year.
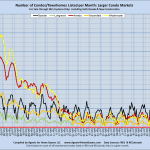
Number of Homes Listed Monthly
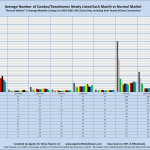
The number of new listings dropped 20 to 40% during the recession, and continued to fall afterwards, so that new listings reached levels that were 40% to 80% lower than in prior “normal” markets. In these data, we differentiate houses from condos/townhomes, but we don’t differentiate various sized houses.
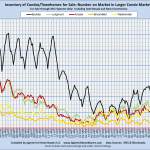
Number of Homes on the Market
As buyers flooded back into the market post-recession, more properties sold more quickly, so that the number of homes on the market, or housing inventory, dropped 10% to 20% more than the number of new listings. The charts in this section track these changes in housing inventory. Again, these data differentiate houses from condos/townhomes, but do not differentiate homes of various sizes.
Number of Home Sales Closing
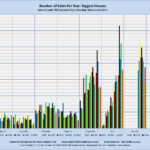
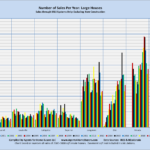
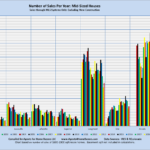
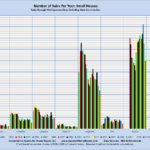
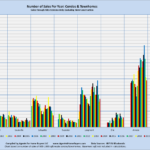
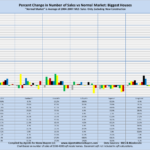
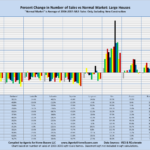
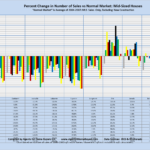
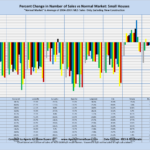
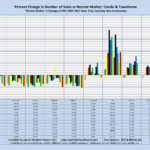
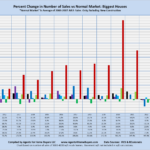
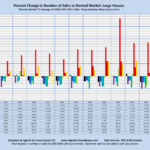
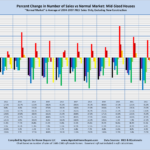
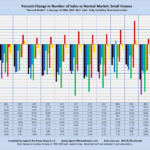
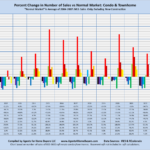
With fewer homes on the market, it’s not that surprising that we have fewer homes selling and closing. The data below show the number of homes listed and sold through the MLS systems on a yearly basis. Except for communities like Erie and Arvada, where builders are adding to the existing housing stock, the number of homes sold each year has dropped 20 to 40% as compared to prior “normal” markets.
Number of homes sold annually: Differentiated by home size and type
Biggest Homes
Large Homes
Midsize Homes
Small Homes
Townhomes & Condos
Number sold compared to normal market: Grouped by city
Number sold compared to normal market: Grouped by year


