Quicklinks
Average Home Prices in Boulder County
Good home buying decisions are based on good information, so we work hard to provide our clients with good data on the Denver-Boulder real estate market. Agents for Home Buyers has been tracking home prices in Boulder, Broomfield, Jeffco, and Weld Counties since 1997.
Explore here to find find current and historical data on:
- home prices
- speed of sale
- number of sales
- types of housing stock
- history of interest rates and how they impact the costs of owning and buying a home
This data is unique to Agents for Home Buyers; you won’t find this data on other real estate websites in this area.
Questions? Contact us. We can help!
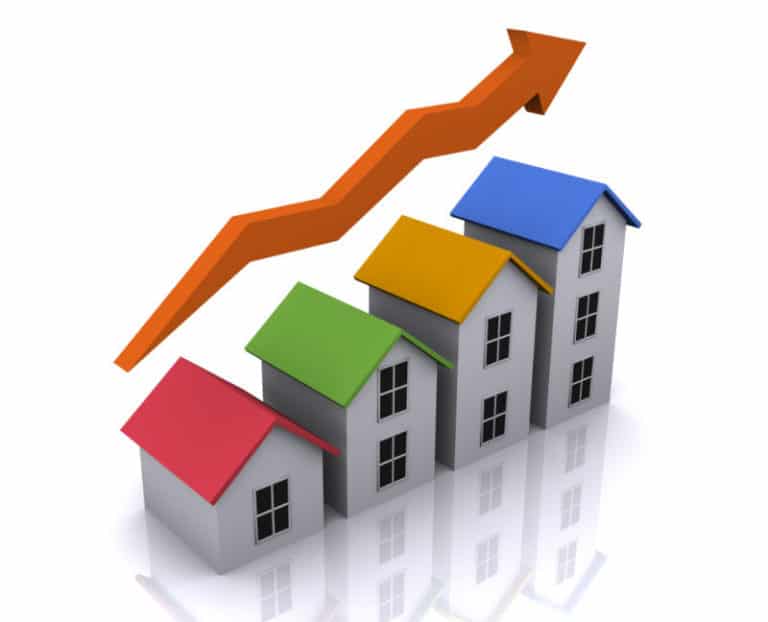
This section provides pricing data from 1997 to date for the ten communities we cover. No matter what kind of home you’re looking for, these data will help you understand what you can expect to pay and how the pricing has changed over the years. We also break out data showing how home prices in the area were impacted by the 2008 recession and how they bounced back afterwards. Finally, we include data on the history of housing prices in the Boulder County and Denver metro areas since 1980 and how these local appreciation rates compare with state and national trends.
These charts provide data on how many homes go under contract within 5 days and 14 days after they were listed for sale. This is a very sensitive measure of buyer pressure on the market, indicating whether there’s likely to be competition for the better properties and how current conditions compare to prior markets in this respect. In slower markets, with more listings available and fewer buyers, we may see 5% to 30% of homes going under contract this quickly. In an extreme seller’s market, with lots of buyers and few listings, these numbers might jump to 40% or 80%

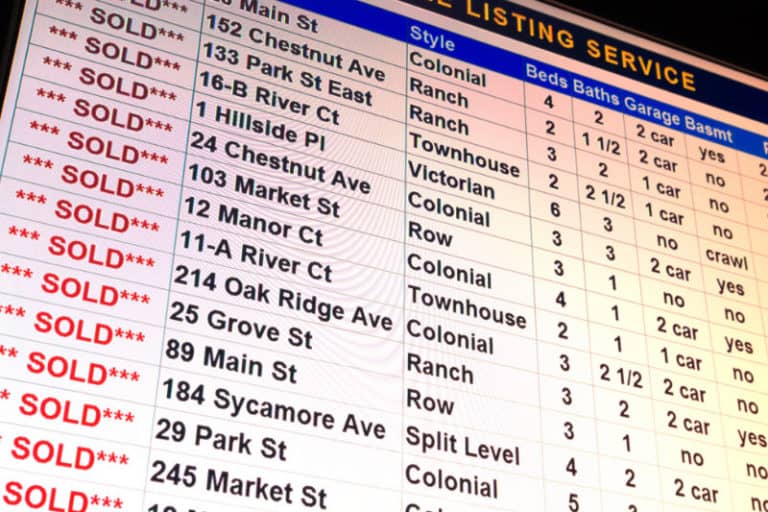
Home prices tend to increase when there are more buyers in the market or fewer homes being listed. These charts show the number of houses and condos being listed each month and how that’s changed over time. Then we provide data on monthly housing inventory, that is, the number of homes on the market at any given point in time. Finally, we provide a detailed comparison of the number of home sales that are closing each year.
In this section, we organize our data to focus on one community at a time.
See charts on home prices for all types of properties in each city. Each chart shows current and historical pricing trends for all housing sizes and types. This makes it easy to compare the current prices for each size or to see which types of homes are selling more quickly.

See home price data for Nederland, Niwot, Lyons and four rural areas we’ve defined in Boulder County, including the high mountains, the foothills near Boulder, and the rural plains to the north and east of Boulder. Because there are fewer sales in these areas, these data are less reliable than those of the larger communities we cover, but they do provide a general sense of current pricing and long-term appreciation rates.
The data in this section will be helpful if you’d like to know pricing and appreciation rates for neighborhoods in Boulder and Longmont broken down by large, midsized, and small houses, as well as condos and townhomes. For each property type, we provide a chart showing price changes from year to year, and another showing cumulative pricing changes over several time periods, including the recession, the recovery post-recession, and 1997 to date.


WE ARE CURRENTLY UPDATING THE DATA FOR THIS SECTION.
Housing Stock by Type in 10 Boulder Area Communities
In this section, we provide extensive data showing whether the homes in each community are mostly condos or single-family homes, when they were built and how many houses in each community are small, midsized or large. We also map this data, so you can see which neighborhoods in these communities have homes of the size, age and type that you prefer. For example, if you’d like to live in Broomfield, but prefer older homes built prior to 1950, you should know that such homes are common in Longmont but nonexistent in Broomfield. If you’re interested in buying a townhome or condo, it may help to know that these properties make up more than 35% of the housing stock in Boulder or Gunbarrel, but less than 15% in Louisville or Longmont.
For buyers who can’t pay cash for a home, the monthly payment will depend both on the initial sale price and on the interest rate of their loan. In this section, we provide some historical perspective on mortgage interest rates, from 1972 to date. We translate this interest rate data into more meaningful terms, by charting the payment required to cover a $300,000 loan, showing that this payment peaked at about $4100 in 1981/1982, but dropped to about $1400 in 2012-2017. Finally, we translate this into borrowing power, showing how a $2000 monthly payment in 1981/1982 would cover a $250,000 loan, while from 2012 to 2017, it would have gotten you a loan of around $425,000.