Market Update for March 2021

Market Update for March 2021

Eight years ago, in March of 2013, we suddenly found ourselves conducting most showings with 3 to 10 groups in the house with us. It felt like all the buyers who'd put off buying during the Great Recession had re-entered the market the same week, fundamentally transforming our business and the challenges buyers faced. Rather than adding contract clauses that gave our clients additional leverage or protection, we were drafting clauses that limited our clients' rights to negotiate over inspection issues, low appraisals, and other issues. Rather than trying lower the price through negotiations, we were looking at data from recent sales and pumping the listing agent for information, trying determine how much over asking price our offer needed to be to make us competitive with the 5-15 offers the seller had in hand.

It was "deja vu" all over again about mid-January of this year, as market challenges for buyers ratcheted up to a whole new level. In Boulder, we made two CASH offers on houses priced at around $1 million. Both offers were more than $150K over asking, and we were outbid on both. In Superior, clients offered $110,000 over asking on a house listed at $895,000. We didn't get the house, and the listing agent let us know our offer was 6th of the 9 offers on price. In Arvada, Westminster, Erie, and Thornton, houses listed around $600,000 were going under contract for $50K to $75K over asking. Meanwhile, many new home builders were literally selling faster than they could build and had so many buyers on waiting lists that they stopped adding new buyers to their lists. The nature of the market has changed and we're facing a whole new set of challenges in representing home buyers.

To help give us a better grounding in this new market, we've compiled data from homes listed in our area from January 1, 2021 through March 15, 2021. The data we present on home prices is based on homes listed during this period that had closed by March 15, 2021. This is clearly a very limited data set, but the data still provide a pretty clear feel for our new market.

Housing Prices

Historically, price increases for housing in our area have averaged about 5% year on year. Since 2013, these increases have averaged 8% to 9% annually for detached houses and 9.5% for condos & townhomes. Each year, most of the annual increase has occurred in the first 6 months of the year, with prices plateauing during the second half of the year. For detached homes, the highest annual increases from 2013 to 2020 were in 2014 and 2015, with average increases running in the 12% to 14% range.


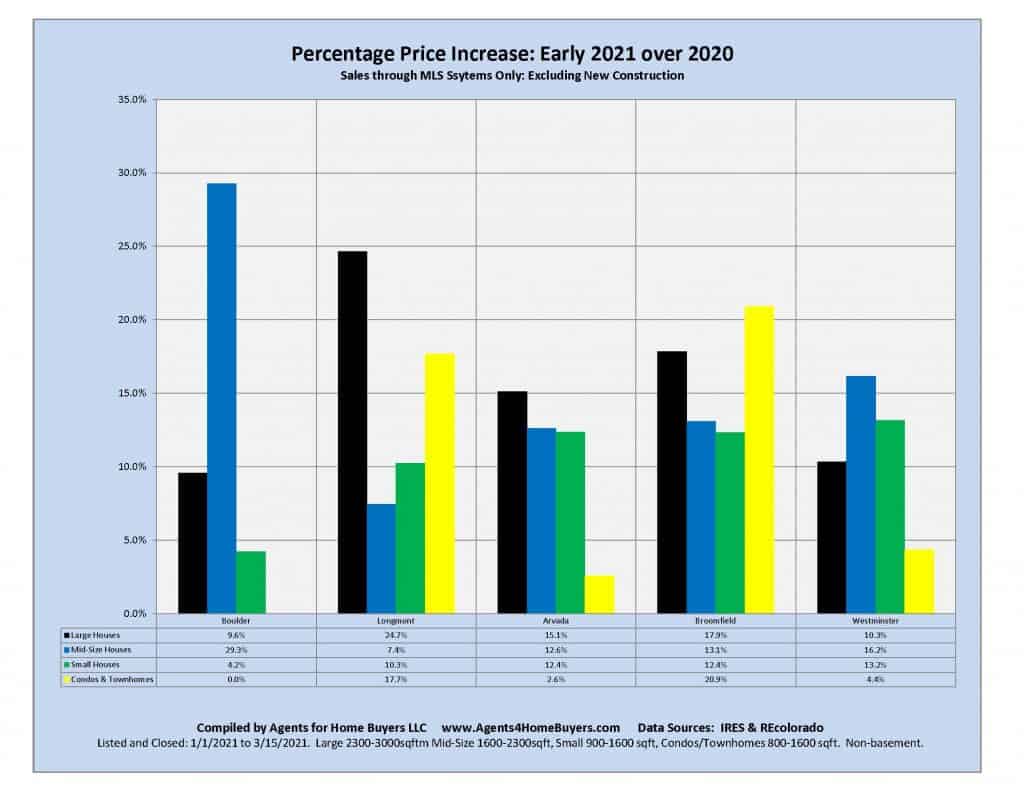
Since our data on closed sales in 2021 are limited, we have restricted our pricing analysis to the five larger communities we routinely cover in our stats; Boulder, Longmont, Arvada, Broomfield and Westminster. As illustrated in the chart below, except for Boulder, the prices for all detached houses have increased between 10% and 15%. Indeed, averaged across the 3 house sizes we break out in these data, all 5 communities experienced price increases of between 13% and 14.4% in the first 10 weeks of 2021, ranging from 13.2% and 13.4% in Westminster and Arvada, to 14.1% for Longmont and 14.4% for Broomfield and Boulder. We've had a couple of years since 2013 where we've seen increases that slightly exceeded these, but those were cumulative increases over the entire year, not increases for the first 10 weeks. We've never seen anything like this before and it's difficult to believe that we won't see median prices for detached houses up by ~20% by June 2021. That's "off the charts" for our market.


The data on price increases for condos and townhomes is less consistent. In Boulder, Arvada and Westminster, condo prices have either been flat or have increased about 4%. In contrast, prices in Longmont and Broomfield are up about 20%. It's hard to predict what will happen with these prices as the year plays out.
Listings and Inventory
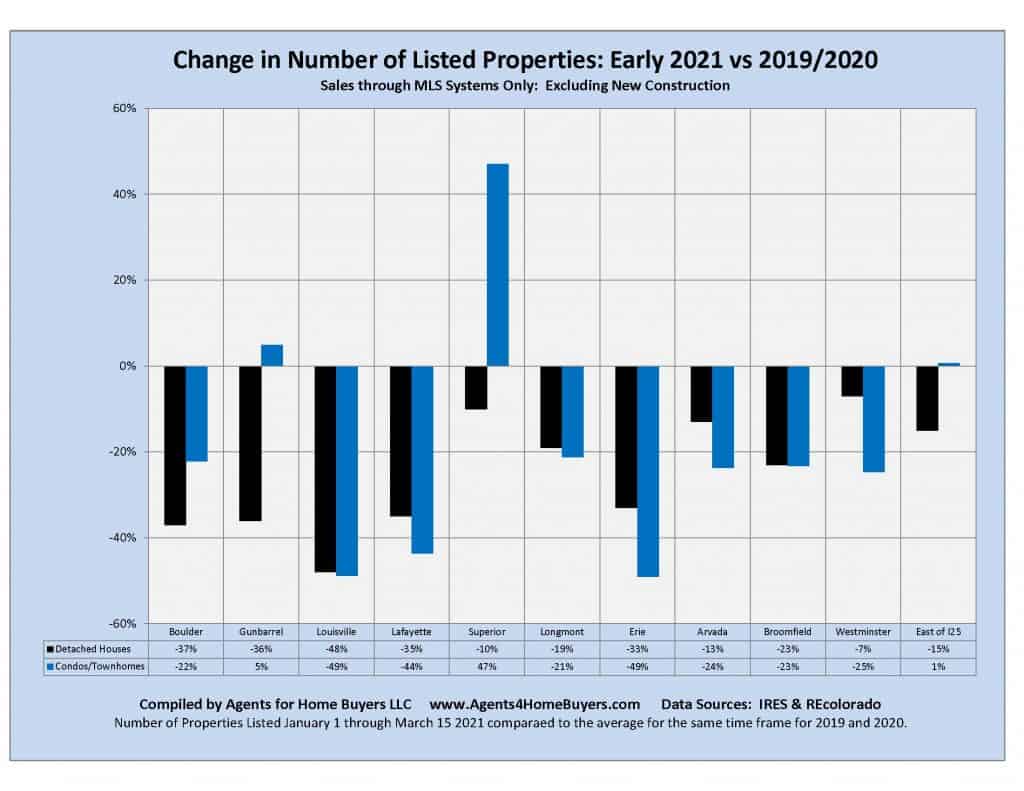
One of the factors driving this market shift is a substantial drop in housing inventory that started in the fall of 2020. That drop in inventory was exacerbated by a dramatic drop in new home listings in early 2021. When compared to the average number of new listings in the January 1 to March 15 time frame for 2019 and 2020, new listings in 2021 dropped an average of 25% across the communities we cover, while listings of townhomes and condos dropped about 20%. In the communities in Boulder's neighborhood, the drop in listing numbers was even larger, running between 35% and 50%. As we pointed out in our January newsletter, the number of houses on the market dropped by about half during the Great Recession...and these low inventories continued after the recession ended. In January of this year, however, inventory levels dropped another 33%, leaving us at about 1/3rd of historic norms. With another 20% to 25% drop in the number of new listings over the past 10 weeks, that puts us at about 25% of "historic norms" with respect to the number of homes on the market.

Houses Selling Faster than Ever

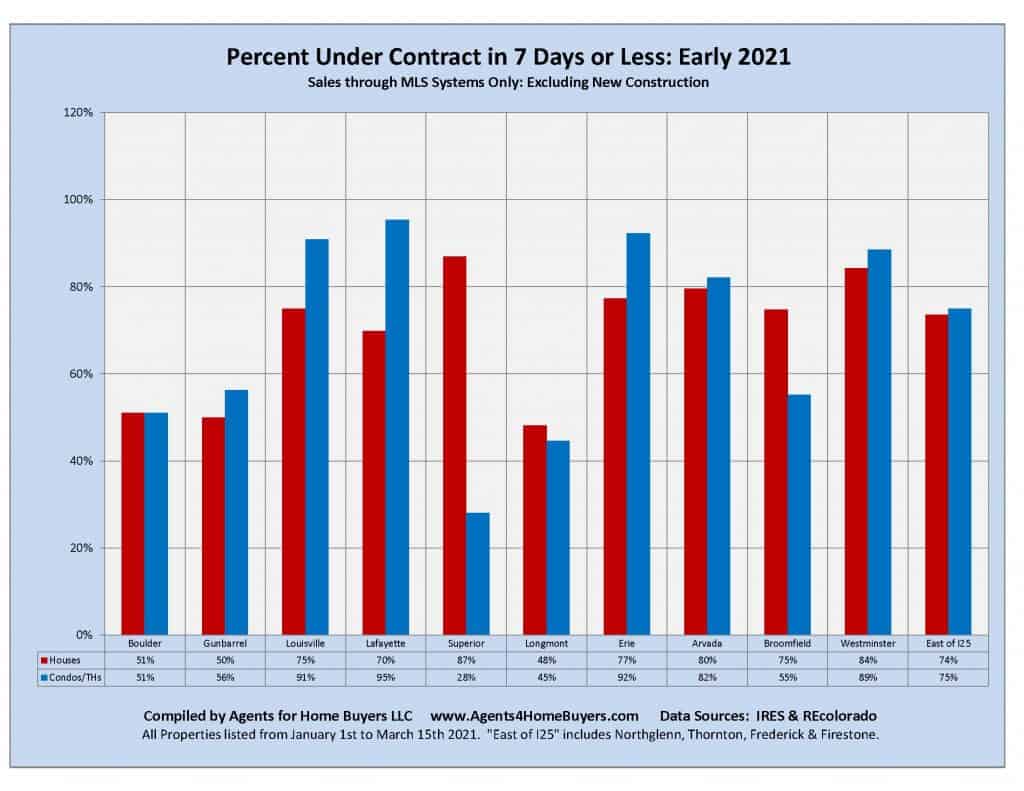
With lots of buyers in the market, and very few homes for sale, houses have gone under contract with unprecedented speed. For many years, we've tracked how quickly homes go under contract once they're listed. Prior to the recession, roughly 25% of detached houses went under contract within the first 2 weeks after listing, and about 15% of condos and townhomes went under contract within the same time frame. From 2013 through 2020, these averages shifted from 25% and 15% to 60% and 65%. In the first 10 weeks of 2021, 80% of detached houses, and 70% of condos/townhomes, have gone under contract in just 7 DAYS. In fact, if we exclude Boulder, Gunbarrel and Longmont...where about 50% of properties went under contract within a week... 75% to 85% of houses in the other communities were going under contract within a week, as were 85% to 95% of condos. In practical terms, all the properties worth buying were under contract within a week of listing
In concrete terms, here is what this means for home buyers. In Gunbarrel, as of 2pm on April 1st, 2021, there were 3 detached houses available for sale. For Louisville and Lafayette, there were 7 available in each. In the 7 Boulder County communities we cover, there was a total of 78 house for sale. In Arvada, Broomfield, and Westminster, there were 71. That's not all the houses meeting the search criteria for a particular buyer, that's all the houses ranging in price from 400K to a couple million...and most of these are still available only because they've either been listed in the past few days or because no buyer in his or her right mind would buy them. If the active buyers working with our office were the only buyers in the market, we could put 1/10th of the properties in either of these areas under contract tomorrow. Most moderate to large real estate offices are probably working with enough buyers that they could put all of the houses currently on the market in either area under contract. The imbalance between supply and demand is daunting.

Asking Price Vs. Selling Price

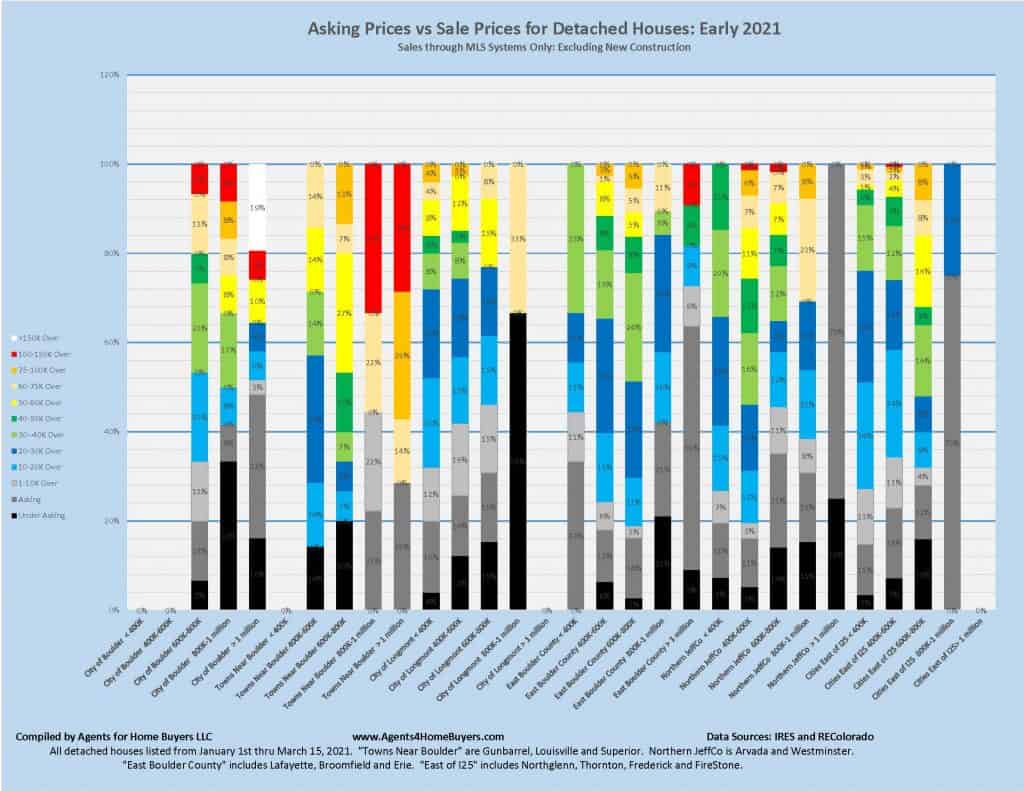
This imbalance of supply and demand underlies the most disturbing feature of this new real estate market, that is, the dramatic increase we've seen in the differential between the seller's asking price and the "winning bid" of the buyer that closes on the sale. The charts below summarize the data for all the sales in our area for homes that were listed since January 1st, 2021 and that closed by March 15th. Even a cursory scan of these data makes it clear why median home prices in the area have jumped by 14% over the past 10 weeks.


The data on detached houses is the most troubling to buyers in this market. There's a lot of data summarized in this chart, so it takes a bit of work to digest, but for anyone who wants to understand what's happening in the market we think it's worth the effort. In the challenging market of 2013 to 2020, we routinely advised clients that they would have to offer $10K to $15K over asking to have a realistic shot at winning the bidding war...and winning offers of $20K to $30K weren't rare. But in 2021, 48% of all the winning offers reflected in this data were MORE than $20K over asking price. For what we've called "Towns Near Boulder" in the chart, which includes Gunbarrel, Louisville and Superior, 68% of all closed sales showed a closing price that was more than $20K over the asking price, while more than half the sales closed at more than $50K over the asking price. In Northern Jefferson County, which includes Arvada and Westminster, 54% of houses sold for more than $20K over asking, and 24% sold for $50K or more over asking. East of I25, and area running from Northglenn and Thornton to Frederick and Firestone, 50% of sales closed at more than $20K over asking, with 15% selling at $50K or more over asking. In Boulder, "only" 30% went for more than $50K over asking, but 1 in 5 buyers making offers on homes over $1,000,000 (the median price in Boulder) closed at more than $150K over asking. There is no safe haven in the area for the buyer who wants a detached, single family house.
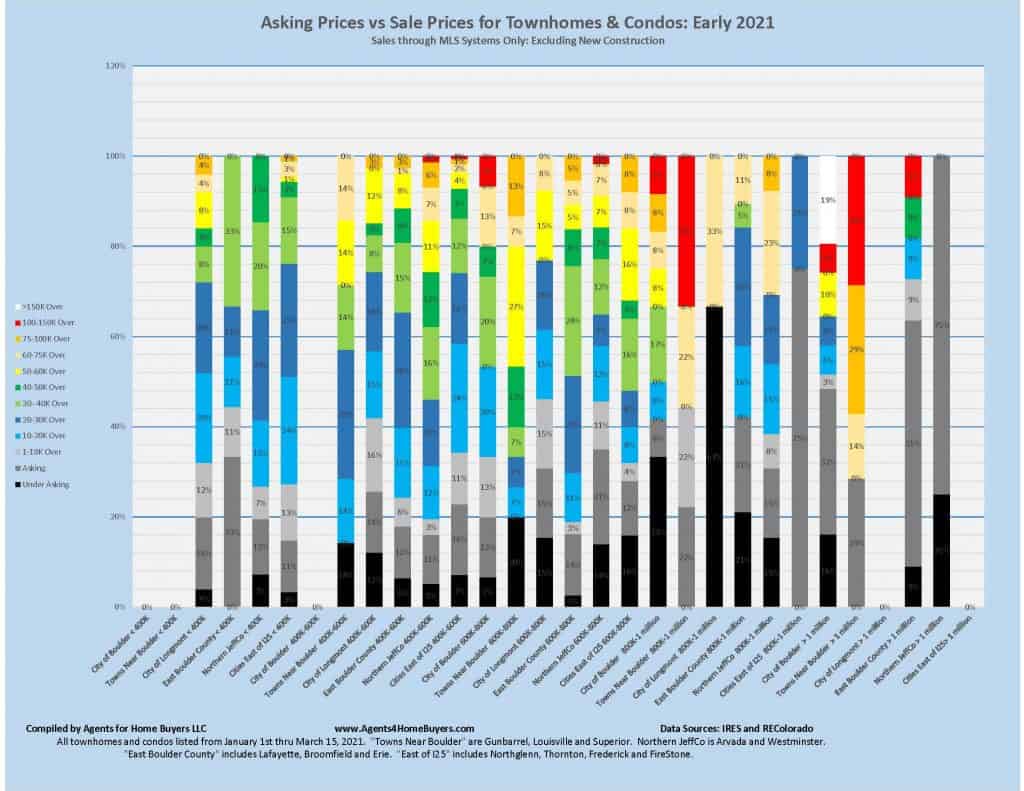
The data in the chart below indicates that the market has been a bit tamer in this respect for condo and townhome buyers. In many communities, more than 70% of buyers paid asking price, less than asking price, or $1-10K over asking for their property. Only in Longmont and Northern Jefferson County have more than half the buyers paid $20K or more over asking, and very few buyers have paid more than $50K over asking. The exception is Northern Jefferson County, where about 15% have paid more than $50K over asking. On balance, the relationship between asking price and sale price reflected in this chart mirrors what we've seen in the 2013 to 2020 market. The market certainly presents a challenge for condo and townhome buyers, but nothing like what we've seen this year in the market for detached houses.
Facebook
Twitter
LinkedIn
Pinterest

Leave a Comment

Agents for Home Buyers • 1470 Walnut St. Suite 201 Boulder, CO 80302
Phone: 303-448-8808Contact the A4HB team

Compass is a licensed real estate broker. All material is intended for informational purposes only and is compiled from sources deemed reliable but is subject to errors, omissions, changes in price, condition, sale, or withdrawal without notice. No statement is made as to the accuracy of any description or measurements (including square footage). This is not intended to solicit property already listed. No financial or legal advice provided. Equal Housing Opportunity. Photos may be virtually staged or digitally enhanced and may not reflect actual property conditions.